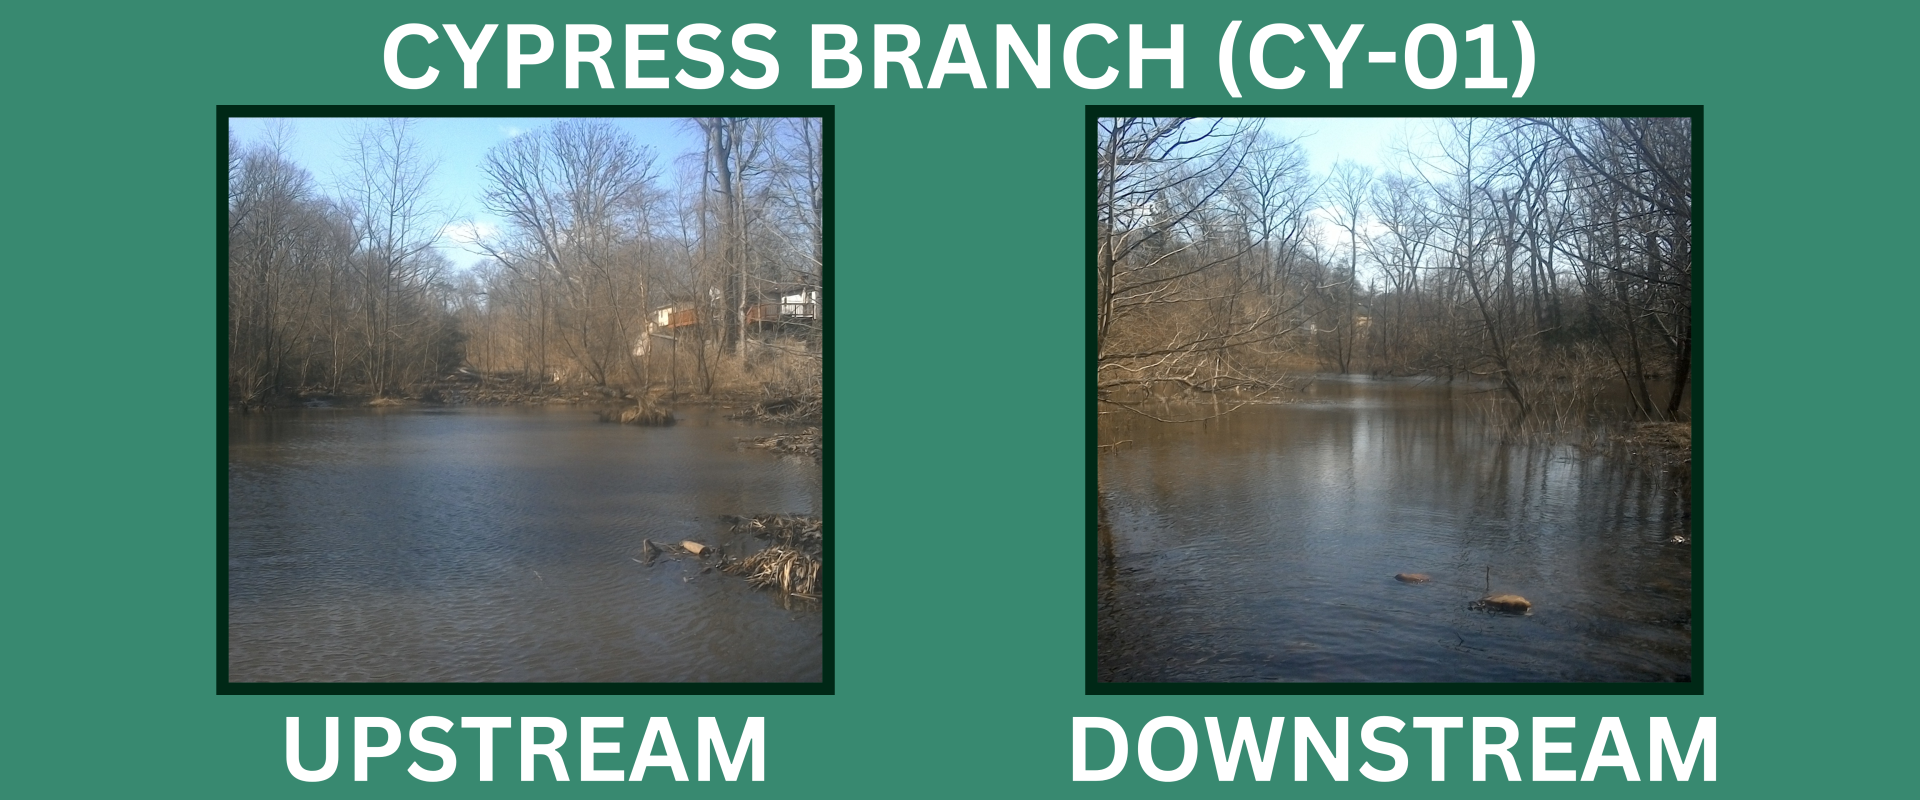
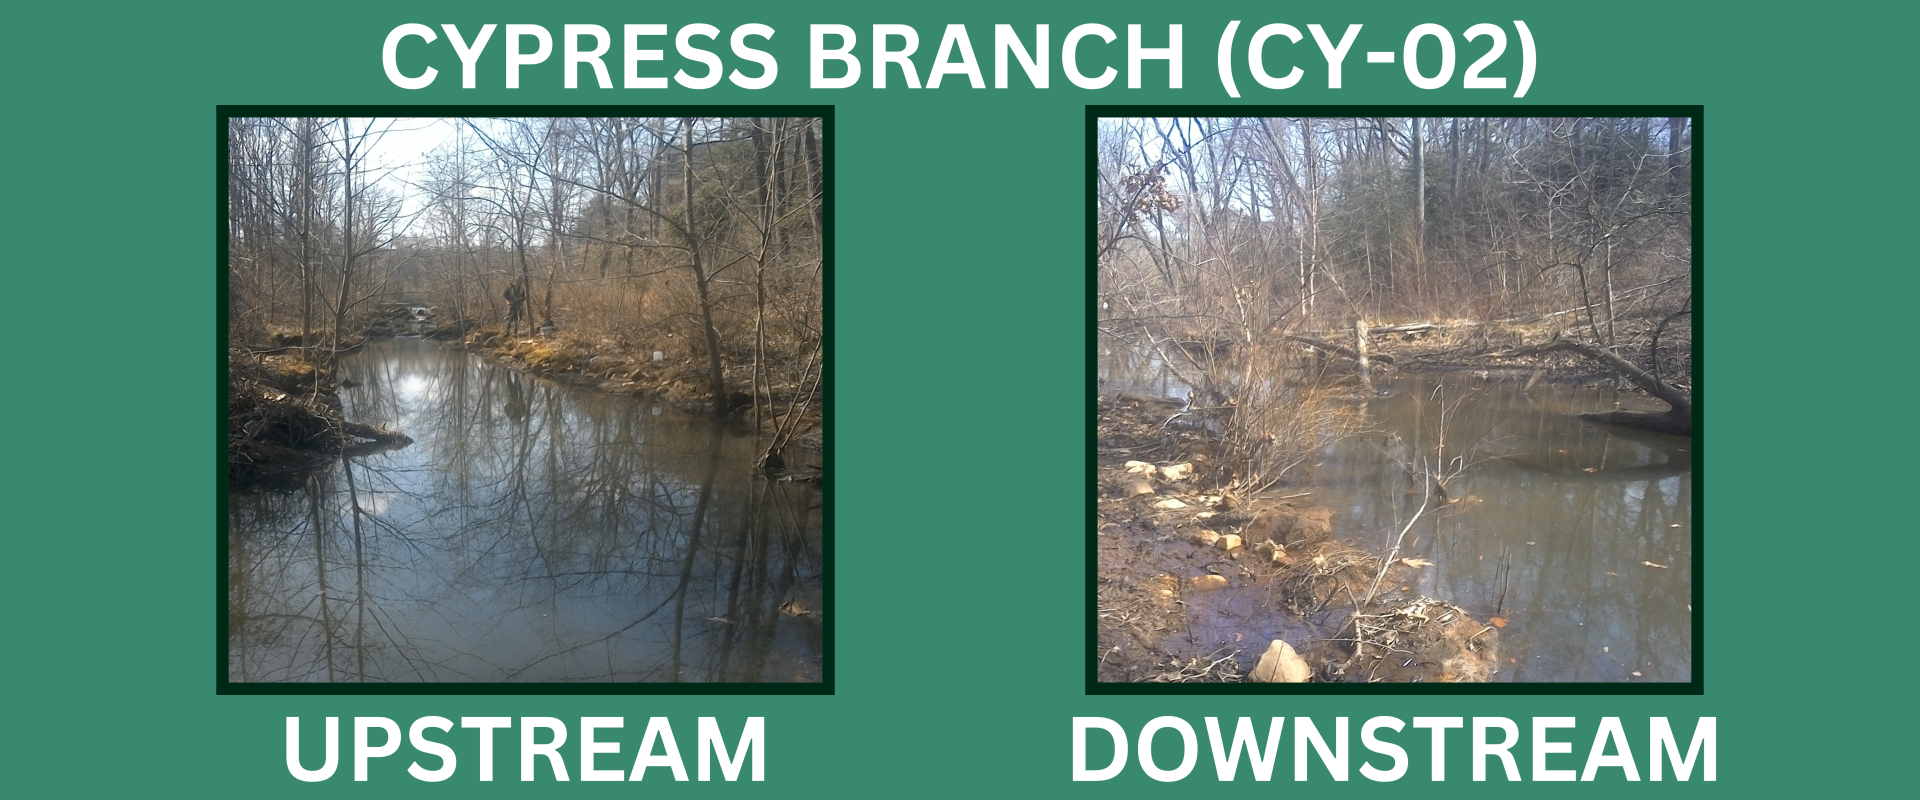
| Site CY-01 | |||
|---|---|---|---|
| Time Frame | BIBI (Condition) | FIBI (Condition)a | RBP (Condition) |
| 2020 Results | -- | 2.33 (Poor) | -- |
| Cumulative Avg. (2009-2020) | 1.74 (Very Poor)bc | 2.58 (Poor)b | 111 (Partially Supporting)b |
| 3-year Running Average | 1.95 (Very Poor)c | 2.56 (Poor) | 136 (Supporting) |
a) Fish data collected in 2015, 2016, 2018, and 2020.
b) No data for 2014.
c) No data for 2020.
| Site CY-02 | |||
|---|---|---|---|
| Time Frame | BIBI (Condition) | FIBI (Condition) | RBP (Condition) |
| 2021 Results | 2.14 (Poor) | -- | 106 (Supporting) |
| Cumulative Average (2009-2021) | 2.00 (Poor)a | 3.00 (Fair)ab | 123 (Partially Supporting)a |
| 3-year Running Average | 2.24 (Poor) | 3.00 (Fair)b | 134 (Supporting) |
a) No data for 2013.
b) Quantitative fish data collected in 2015 only. All other assessments were performed qualitatively due to site characteristics.
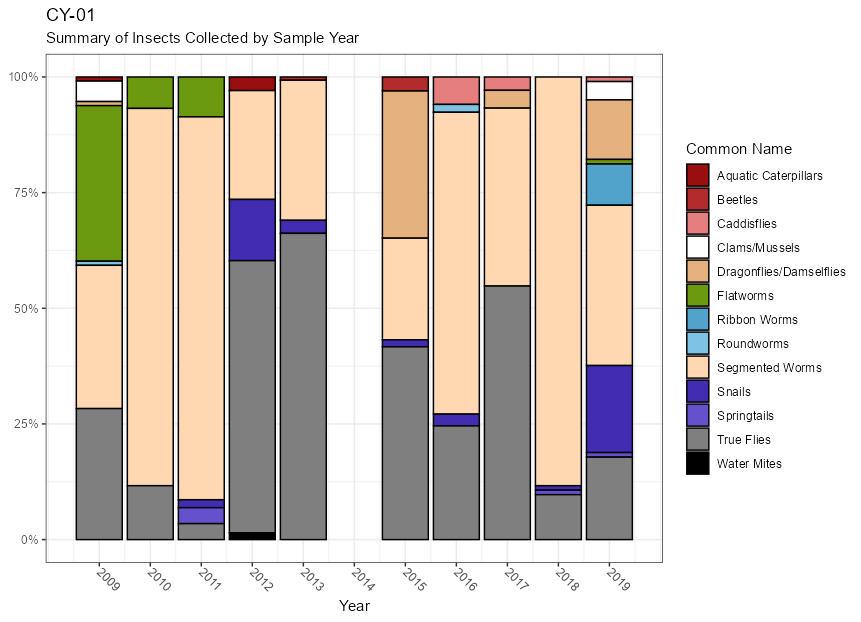
Site CY-01: CY-01 is the upstream site of the two Cypress Creek monitoring locations, situated just downstream of the RT 2 road crossing. This reach was modified in 2013 as part of an extensive restoration project. In 2019 the site received a BIBI score of 2.43 (Poor), the highest score at the site since monitoring began in 2009. Historically, samples at the site were dominated by worms and non-biting midges. While segmented worms remained the most abundant organism in the 2019 sample, this group was present at a much lesser extent than observed in prior samples. Snails and damselflies emerged as the second and third most abundant organisms, respectively, and dragonflies were found for the first time at the site. It should also be noted that total taxa diversity peaked in the 2019 sample. These changes in community structure may be partially due to the arrival of beavers that same year.
The ultimate trajectory in benthic condition remains unclear, but it should be noted that the running average BIBI score of 1.95 over the final three years of monitoring was higher than the cumulative average of 1.74, although both of these values are in the Very Poor range.
CY-01 Summary of Insects Collected by Sample Year:
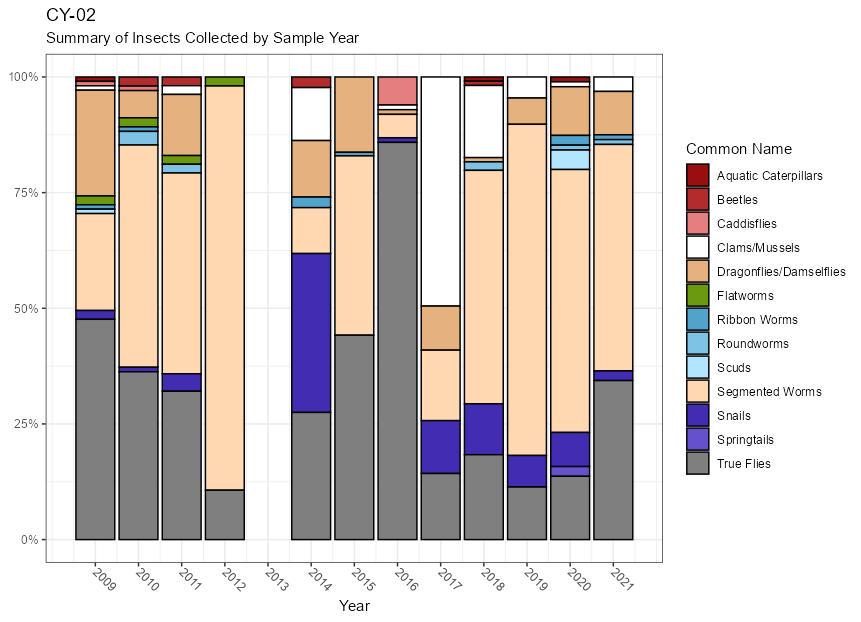
Site CY-02: In 2021, CY-02 received a BIBI score of 2.14 (Poor), consistent with ratings dating back to 2017. The reach containing this site was dramatically altered by the restoration work that occurred here, and has a character more similar to an emergent wetland than a free flowing stream. Additionally, beavers moved downstream from CY-01 to this site in late 2020, creating a wide and ultimately non-wadeable impoundment. These conditions made sampling impractical and the decision was made to cease sampling after the 2021 season. Like prior years, segmented worms and true flies dominated the sample again in 2021. The final three-year average BIBI score is 2.24 (Poor), and the cumulative average is 2.00 (Poor).
CY-02 Summary of Insects Collected by Sample Year:
The 2020 fish data represent the most recent fisheries information for these sites.
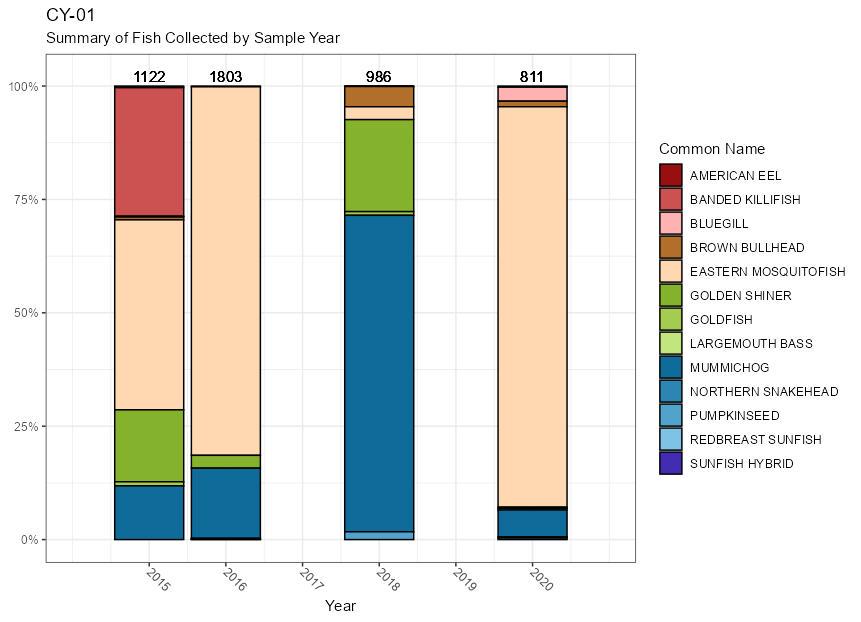
Site CY-01: In 2020, the site received a FIBI score of 2.33 (Poor). 811 individuals representing nine species were observed, with eastern mosquitofish (Gambusia holbrooki) dominating the sample. Two northern snakeheads (Channa argus), a non-native and highly disruptive species, were found in 2020.
CY-01 Summary of Fish Collected by Sample Year:
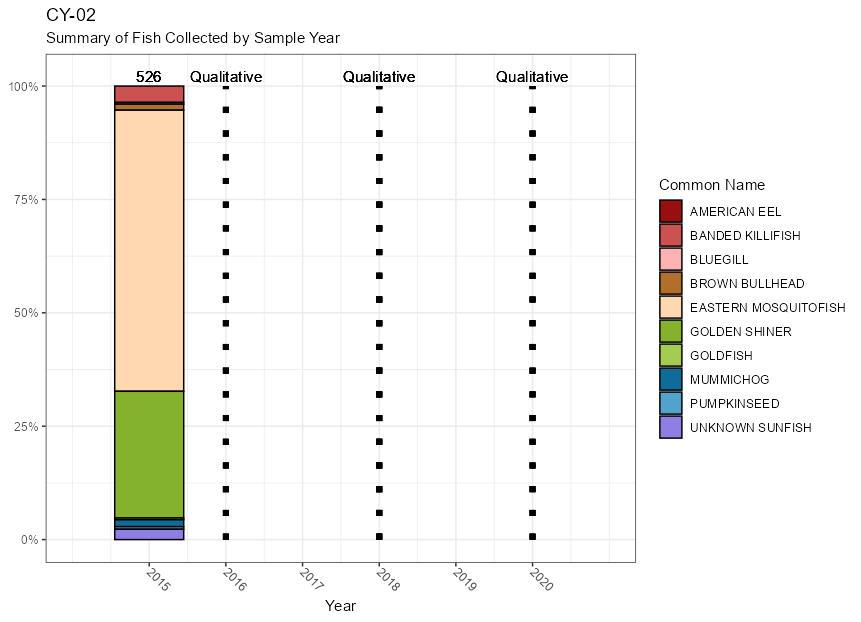
Site CY-02: 2015 was the only year that a quantitative fish survey was performed at this site, resulting in a FIBI score of 3.00 (Fair). Only qualitative fish surveys were conducted in 2016, 2018, and 2020 due to site characteristics - the large pools that comprise portions of this reach prevented the setting of block nets that isolate a reach from its overall stream system during sampling. Without an actual count, the calculation of a multi-metric index such as the FIBI is impossible. The 2020 qualitative survey identified four species - eastern mosquitofish, golden shiner (Notemigonus crysoleucas), mummichog (Fundulus heteroclitus), and pumpkinseed (Lepomis gibbosus) - with eastern mosquitofish reported as being the most abundant.
CY-02 Summary of Fish Collected by Sample Year:
Site CY-01: Aquatic habitat conditions at CY-01 have improved since restoration. In 2019, the site had an RBP score of 132 and a corresponding rating of “Supporting).” The post-restoration 3-year average of 136 (Supporting) shows a marked improvement over the pre-restoration average of 85 (Non-supporting).
Site CY-02: In 2021, the site received an RBP score of 106 (Partially Supporting). The post-restoration 3-year average score is 134 (Supporting), which shows improvement compared to the pre-restoration average of 103 (Partially Supporting). The lower RBP score in 2021 is a result of moderate to low scores in epifaunal and pool substrate and low scores in channel alteration and sinuosity.
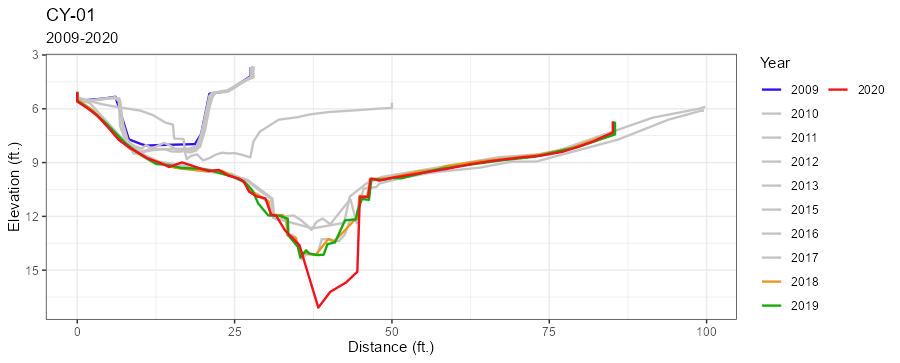
Site CY-01: The channel bottom incised considerably between 2019 and 2020 lowering the stream bed elevation by approximately 3 feet. This change may be due to the increased beaver activity at this site, or could be related to the distribution of cobbles across the cross section. Geomorphological assessment of the site ended after 2020 due to beaver activity.
CY-01 Cross-Section Comparison:
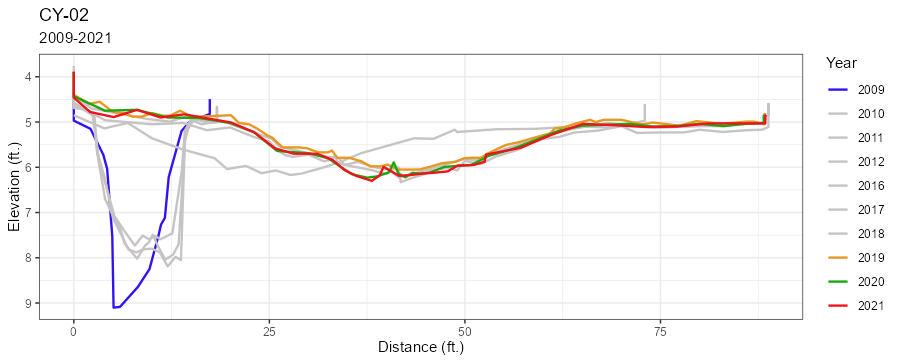
Site CY-02: A new cross section was established in 2016 because the monuments established in 2012 could not be recovered following the restoration. In addition, no cross section was measured in 2014 or 2015. However, a cursory comparison of the initial post-restoration measurement of the channel shows it to be much less entrenched than prior to restoration work, with the channel bottom elevation approximately two feet higher in 2021 than in 2012. The prior four assessments dating back to 2017 show that this section has largely remained unchanged and appears stable.
CY-02 Cross-Section Comparison:
| CY-01 | |||
|---|---|---|---|
| Year | BIBI (Condition) | FIBI (Condition) | RPB (Condition) |
| 2009 | 1.57 (VP) | --- | 66 (NS) |
| 2010 | 1.57 (VP) | --- | 117 (PS) |
| 2011 | 1.00 (VP) | --- | 73 (NS) |
| 2012 | 1.86 (VP) | --- | 62 (NS) |
| 2013 | 2.14 (P) | --- | 106 (PS) |
| 20142 | --- | --- | --- |
| 2015 | 1.57 (VP) | 2.67 (P) | 144 (S) |
| 2016 | 1.86 (VP) | 2.67 (P) | 134 (S) |
| 2017 | 1.86 (VP) | --- | 145 (S) |
| 2018 | 1.57 (VP) | 2.67 (P) | 132 (S) |
| 2019 | 2.43 (P) | -- | 132 (S) |
| 2020 | ---1 | 2.33 (P) | ---1 |
1) Site not sampled in 2014 due to restoration activity.
| CY-02 | |||
|---|---|---|---|
| Year | BIBI (Condition) | FIBI (Condition) | RBP (Condition) |
| 2009 | 2.43 (P) | --- | 90 (NS) |
| 2010 | 2.14 (P) | --- | 117 (PS) |
| 2011 | 1.00 (VP) | --- | 113 (PS) |
| 2012 | 1.29 (VP) | --- | 91 (NS) |
| 2013 | ---a | ---a | ---a |
| 2014 | 2.43 (P) | --- | 111 (PS) |
| 2015 | 1.57 (VP) | 3.00 (F) | 151 (C) |
| 2016 | 1.57 (VP) | --- | 129 (S) |
| 2017 | 2.43 (P) | --- | 146 (S) |
| 2018 | 2.43 (P) | --- | 125 (PS) |
| 2019 | 2.14 (P) | --- | 147 (S) |
| 2020 | 2.43 (P) | --- | 148 (S) |
| 2021 | 2.14 (P) | --- | 106 (PS) |
a) Site not sampled in 2013 due to restoration activity.
| Stations Summary | ||||||
|---|---|---|---|---|---|---|
| Average BIBI (SD) | 3-Year Average BIBI (SD) | Average RPB (SD) | 3-Year Average RBP (SD) | Average FIBI (SD) | 3-Year Average RBP (SD) | |
| CY-01 | 1.74 (0.39) | 1.95 (0.44) | 111 (33) | 136 (8) | 2.58 (0.17) | 2.56 (0.20) |
| CY-02 | 2.00 (0.51) | 2.24 (0.17) | 123 (22) | 134 (24) | 3.00 (NA)a | 3.00 (NA)a |
a) Quantitative fish data collected in 2015 only.
SD = Standard Deviation

