
| Site MC-01 | |||
|---|---|---|---|
| Time Frame | BIBI (Condition) | FIBI (Condition)a | RBP (Condition) |
| 2024 Results | 2.43 (Poor) | 2.00 (Poor) | 137 (Supporting) |
| Cumulative Average (2010-2024) | 2.58 (Poor) | 2.72 (Poor) | 125 (Partially Supporting) |
| 3-year Running Average | 2.43 (Poor) | 2.78 (Poor) | 146 (Supporting) |
| Site MC-02 | |||
|---|---|---|---|
| Time Frame | BIBI (Condition) | FIBI (Condition)a | RBP (Condition) |
| 2024 Results | 2.71 (Poor) | 1.67 (Very Poor) | 103 (Partially Supporting) |
| Cumulative Average (2010-2024) | 2.43 (Poor) | 1.67 (Very Poor) | 108 (Partially Supporting) |
| 3-year Running Average | 2.43 (Poor) | 1.67 (Very Poor) | 104 (Partially Supporting) |
| Site MC-03 | |||
|---|---|---|---|
| Time Frame | BIBI (Condition) | FIBI (Condition)a | RBP (Condition) |
| 2024 Results | 3.00 (Fair) | 1.67 (Very Poor) | 102 (Partially Supporting) |
| Cumulative Average (2010-2024) | 2.47 (Poor) | 1.89 (Very Poor) | 116 (Partially Supporting) |
| 3-year Running Average | 2.81 (Poor) | 1.78 (Very Poor) | 108 (Partially Supporting) |
| Site MC-04 | |||
|---|---|---|---|
| Time Frame | BIBI (Condition) | FIBI (Condition)a | RBP (Condition) |
| 2024 Results | 2.14 (Poor) | 1.67 (Very Poor) | 102 (Partially Supporting) |
| Cumulative Average (2010-2024) | 2.37 (Poor) | 1.78 (Very Poor) | 111 (Partially Supporting) |
| 3-year Running Average | 2.14 (Poor) | 1.67 (Very Poor) | 109 (Partially Supporting) |
a. Fish data collected in 2015, 2016, 2018, 2022, and 2024.
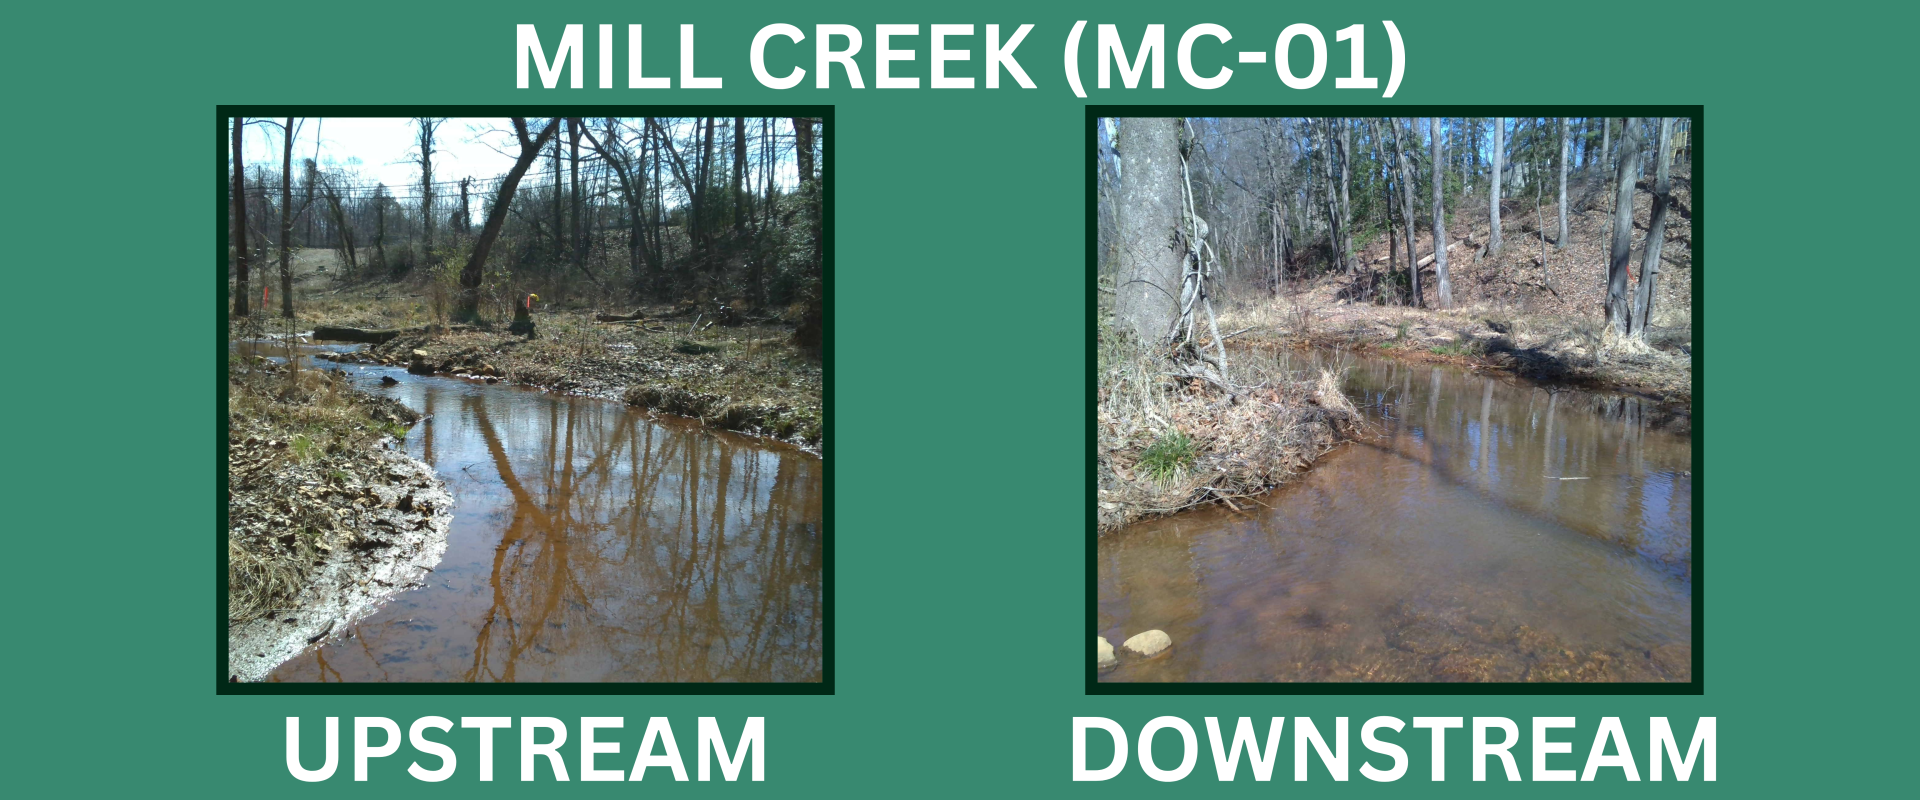
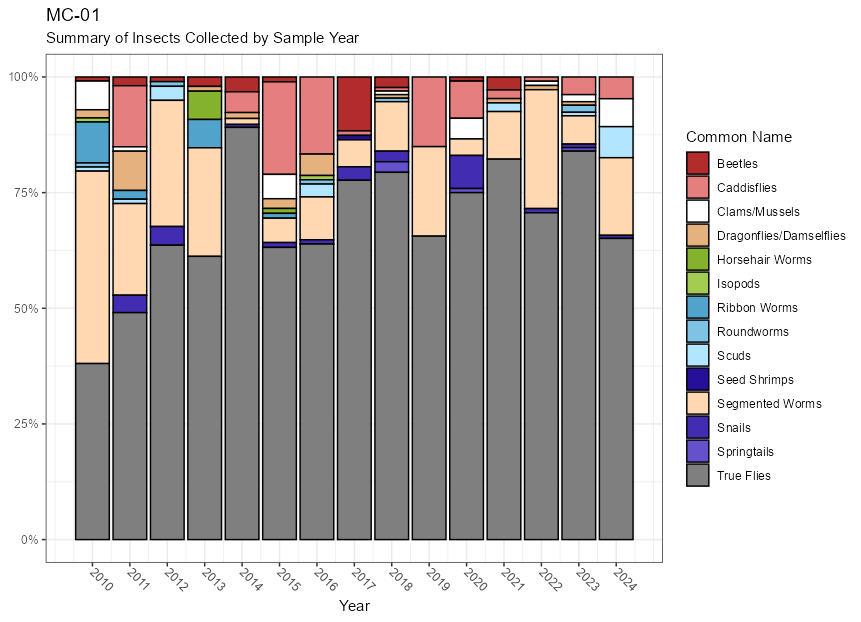
Site MC-01: MC-01 received a BIBI score of 2.43 (Poor) in 2024. While the site has received “Fair” ratings in the past, it has been rated as “Poor” in four consecutive years and eight out of the last ten. The three-year running average BIBI score is 2.43 (Poor) and the cumulative average is 2.58 (Poor). Similar to prior years, the 2024 sample was dominated by true flies and segmented worms.
MC-01 Summary of Insects Collected by Sample Year:
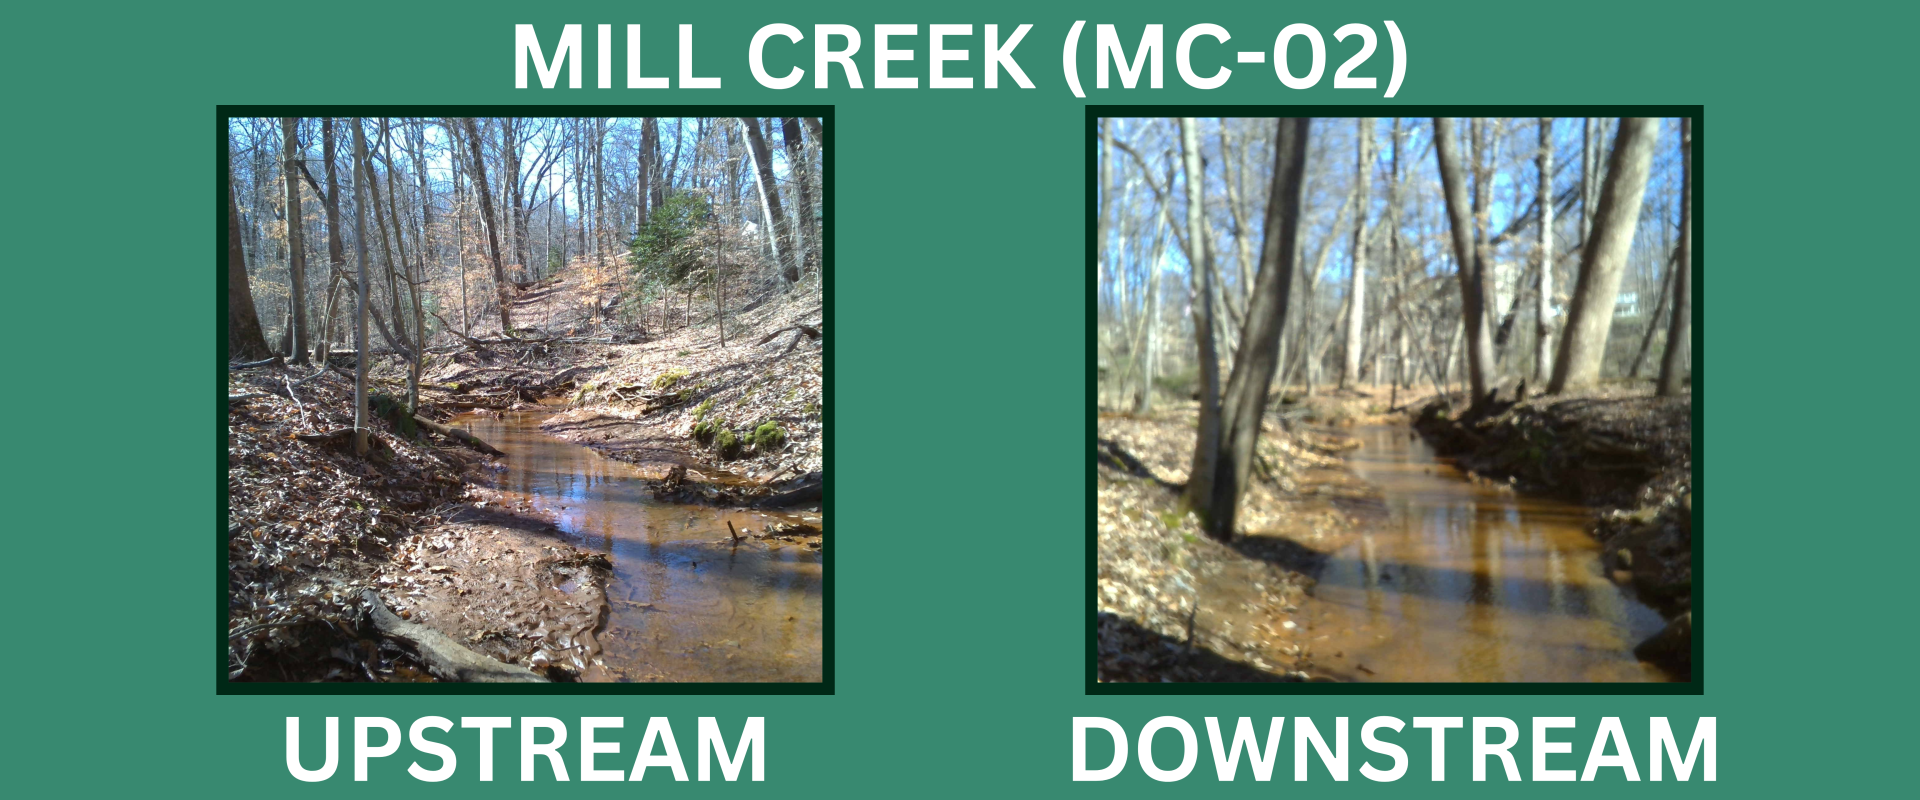
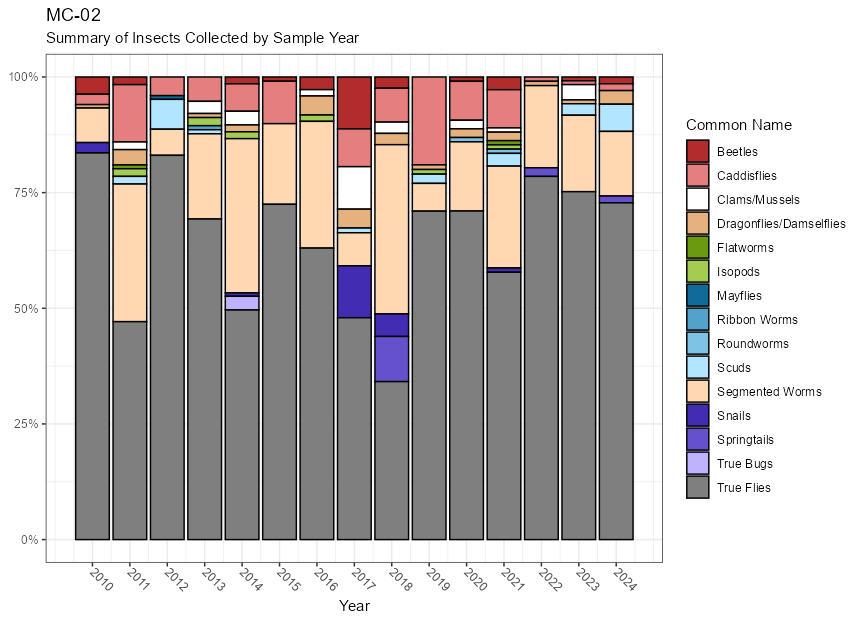
Site MC-02: This site is located upstream of MC-01 and downstream of the confluence of the two reaches that contain MC-03 and MC-04. This site has an intact riparian buffer of approximately 60 meters on both sides of the stream. In 2024, this site received a BIBI score of 2.71 (Poor), an improvement from the previous year. The site has received “Fair” ratings in the past, but has been rated as “Poor” or “Very Poor” for seven years running. The 2023 sample, like most previous years, was dominated by true flies and segmented worms.
MC-02 Summary of Insects Collected by Sample Year:
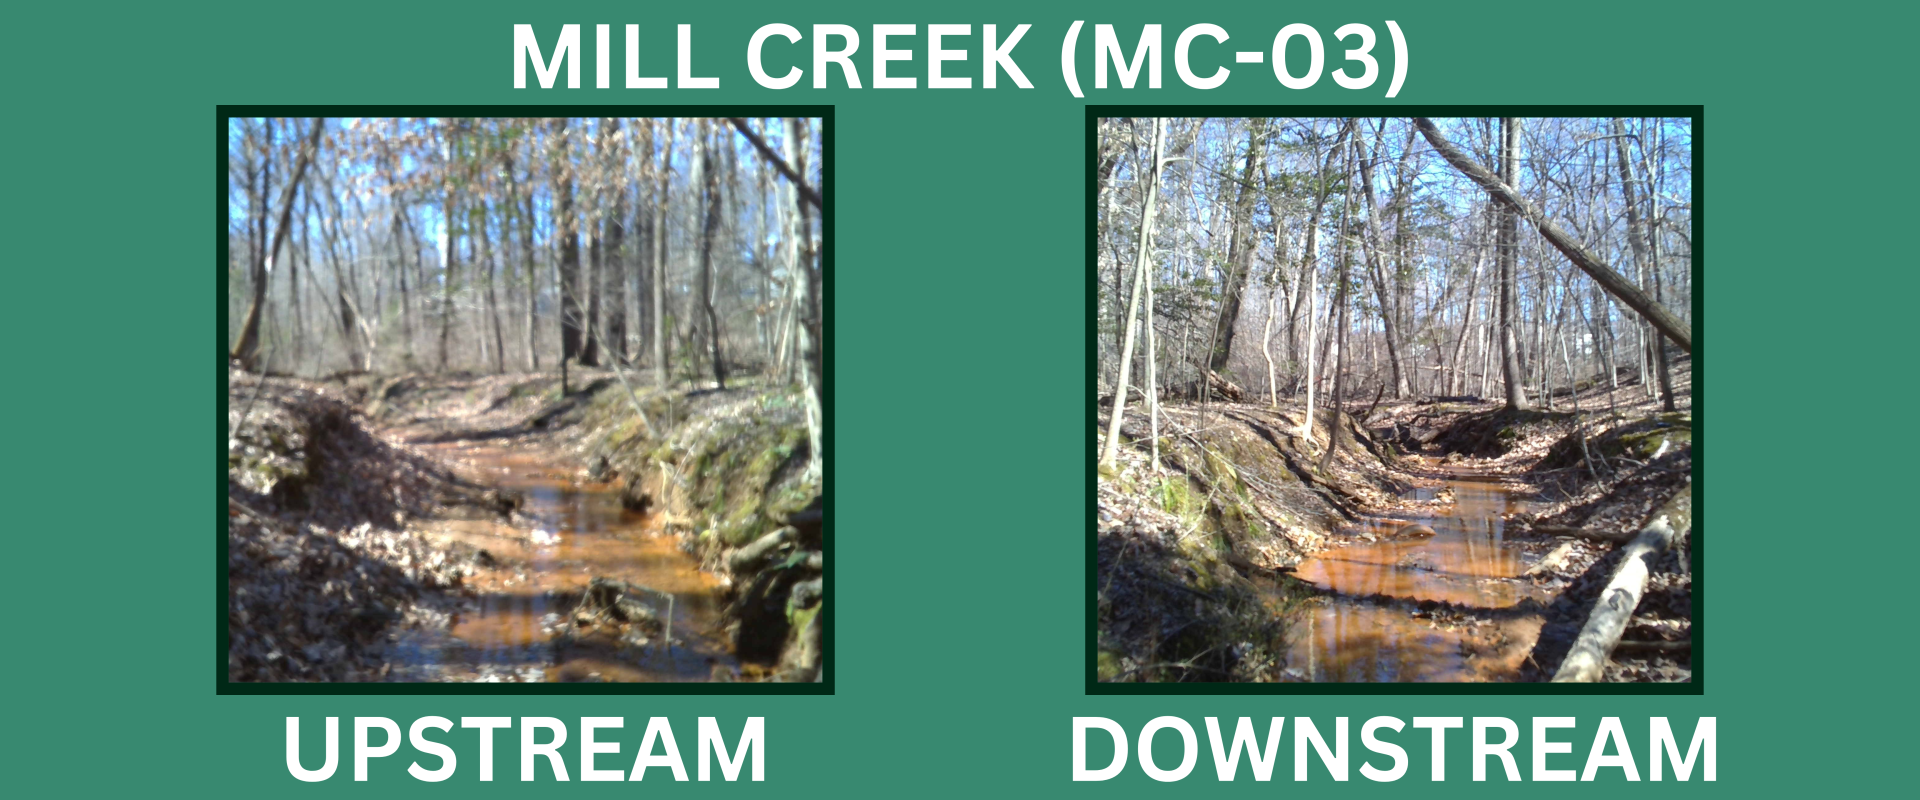
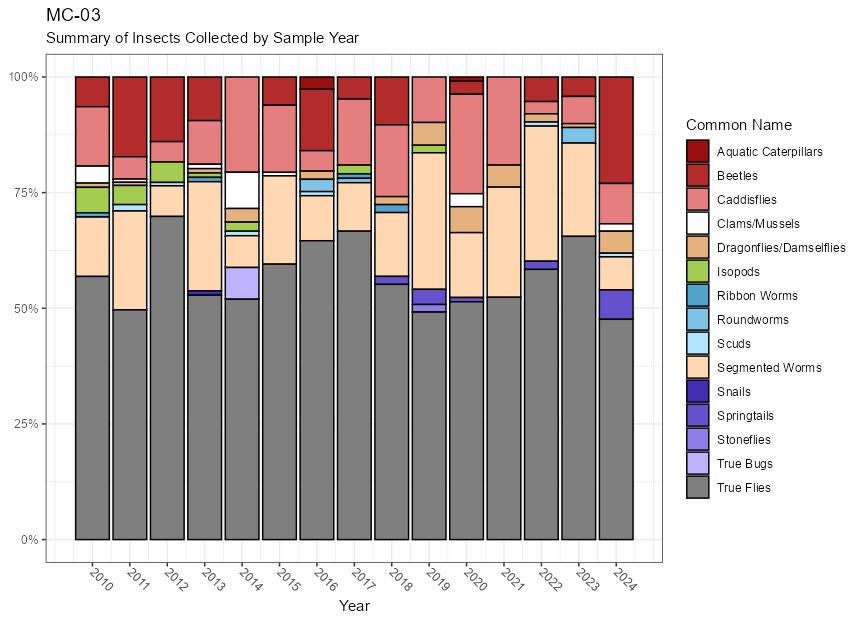
Site MC-03: MC-03 is located on the western branch of Mill Creek after the split upstream of MC-02. It is similar in character to the other Mill Creek sites in that it is well-buffered by a forested riparian area, particularly on the east side of the stream.
The 2024 BIBI score was 3.00 (Fair), the highest score/rating the site has received since 2017. While true flies were the dominant organism - similar to the other Mill Creek sites - the contribution of beetles, caddisflies, and dragonflies to the sample resulted in a higher score compared to the other sites.
MC-03 Summary of Insects Collected by Sample Year:
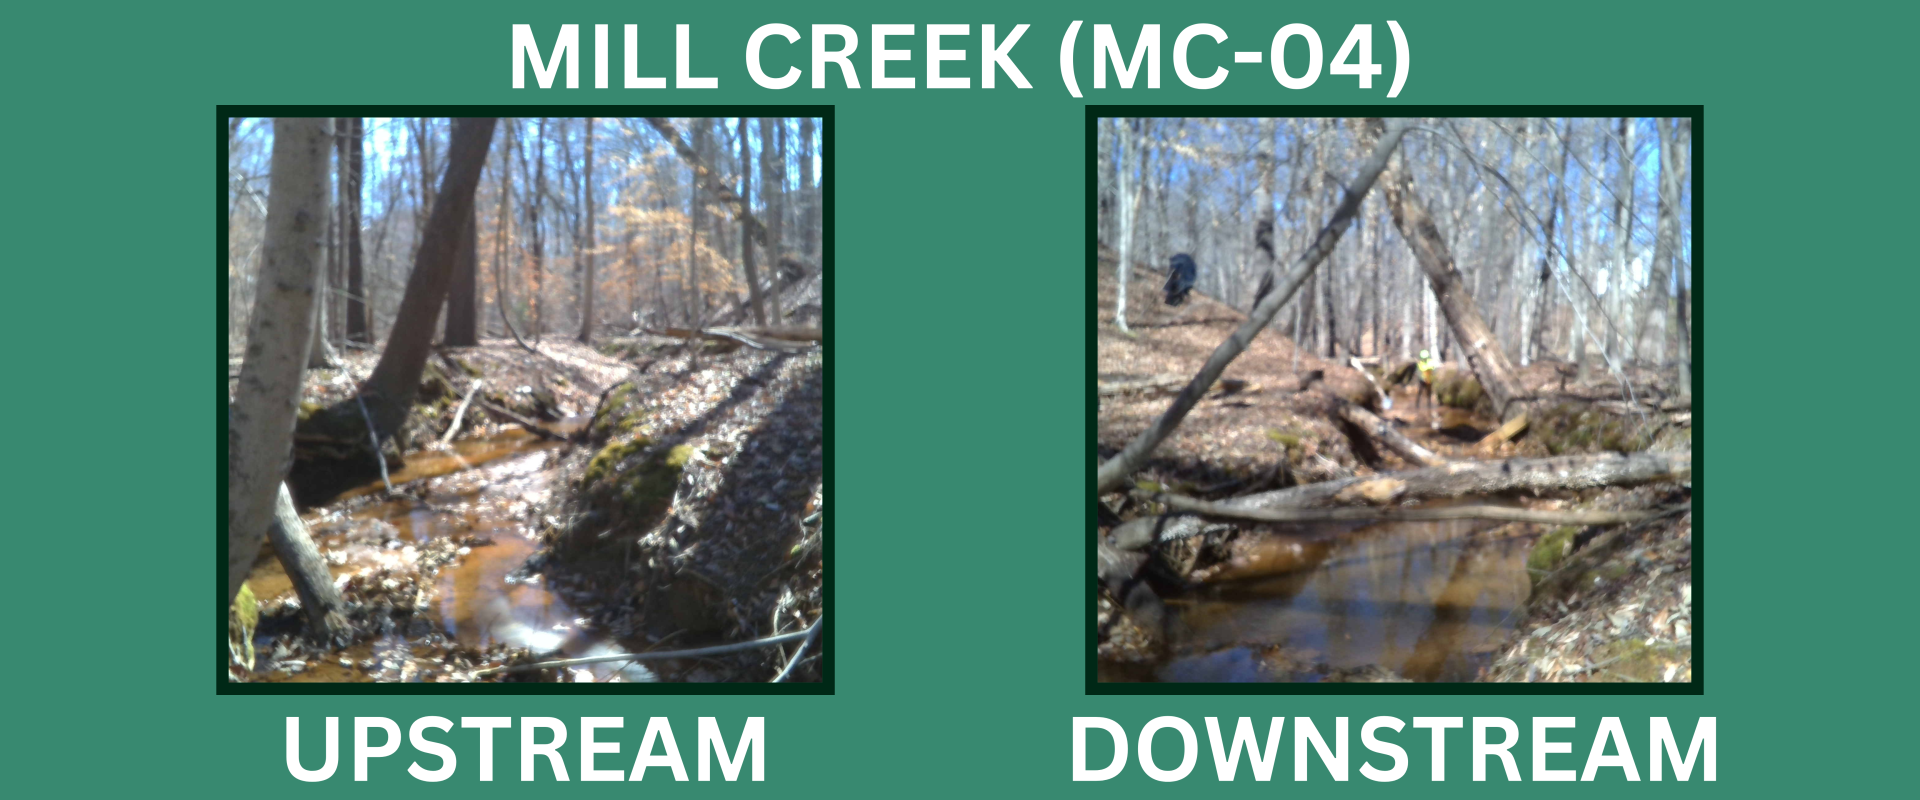
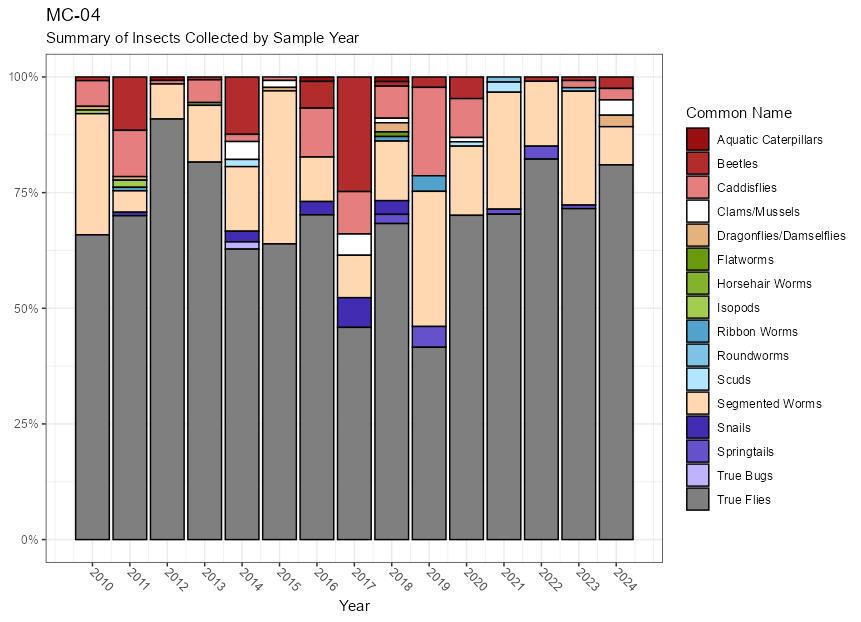
Site MC-04: MC-04 is located on the eastern branch of Mill Creek after the split upstream of MC-02. Like the other Mill Creek sites, MC-04 is well-buffered by a forested riparian area, particularly on the western side of the stream. For the fifth consecutive year, this site’s BIBI score was 2.14 (Poor). The site has received a rating of “Poor” or “Very Poor” for all years of monitoring except for 2018 (when it received a rating of “Fair”). The 2024 sample was dominated by true flies, which comprised approximately 80 percent of the sample.
MC-04 Summary of Insects Collected by Sample Year:
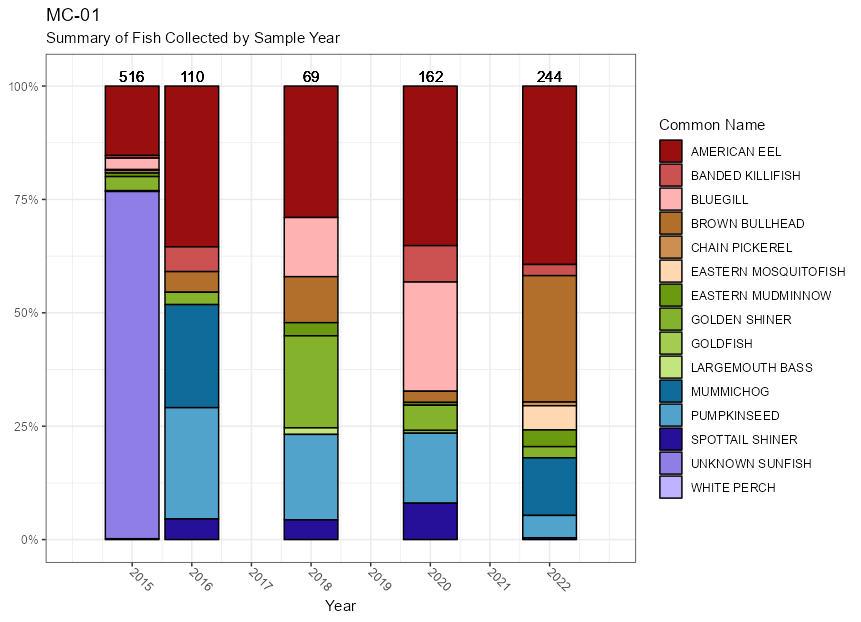
Site MC-01: The site received a FIBI score 2.00 (Poor) in 2024, a sharp decline from a score of 3.33 (Fair) in 2022. The 2024 score is the lowest in the six years of fish sampling at the site dating back to 2015. The number of individual fish per sample dropped from 244 in 2022 to 104 in 2024. Eight species were observed in 2024, with American eel (Anguilla rostrata) and mummichog (Fundulus heteroclitus) comprising the bulk of the sample. Notably, fifteen different species have been observed here since 2015, making it the most diverse site in the long term targeted monitoring program,despite levels of impervious surface (~26%) that often result in depressed fish populations.
MC-01 Summary of Fish Collected by Sample Year:
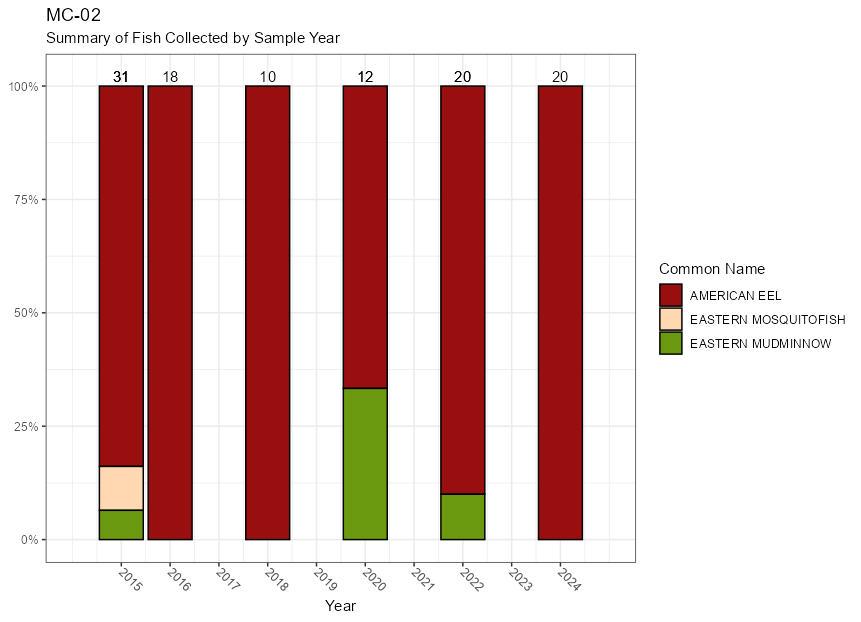
Site MC-02: In 2024, like all five previous fish sampling years, the FIBI score was 1.67 (Very Poor). Twenty individual fish representing only one species - American eel (Anguilla rostrata) - were collected during the 2024 sampling.
MC-02 Summary of Fish Collected by Sample Year:
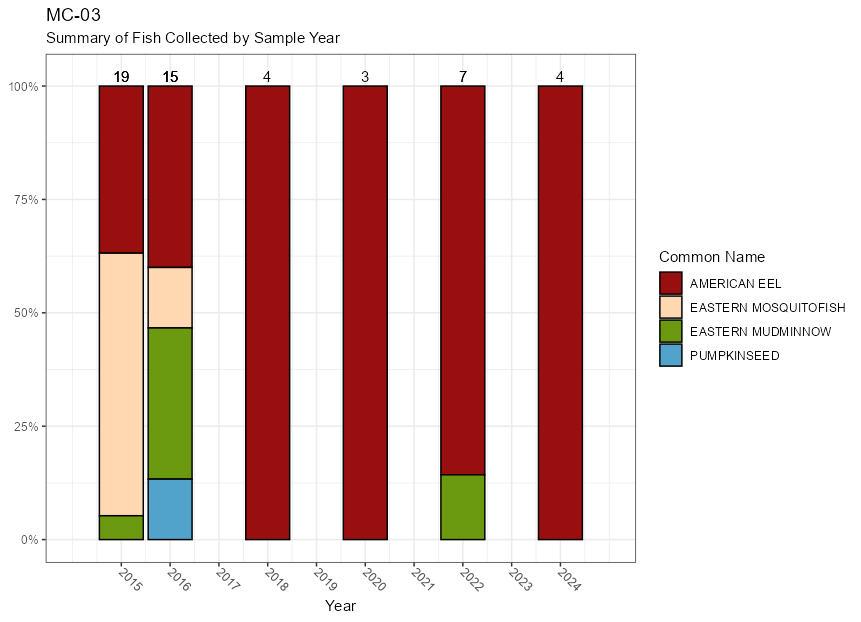
Site MC-03: The site received a FIBI score of 1.67 (Very Poor) in 2024. The FIBI at MC-03 has been in the “Poor” or “Very Poor” categories every sampling year. American eel (Anguilla rostrata) was the only species observed at this site in 2024, and only four individuals were present in the sample.
MC-03 Summary of Fish Collected by Sample Year:
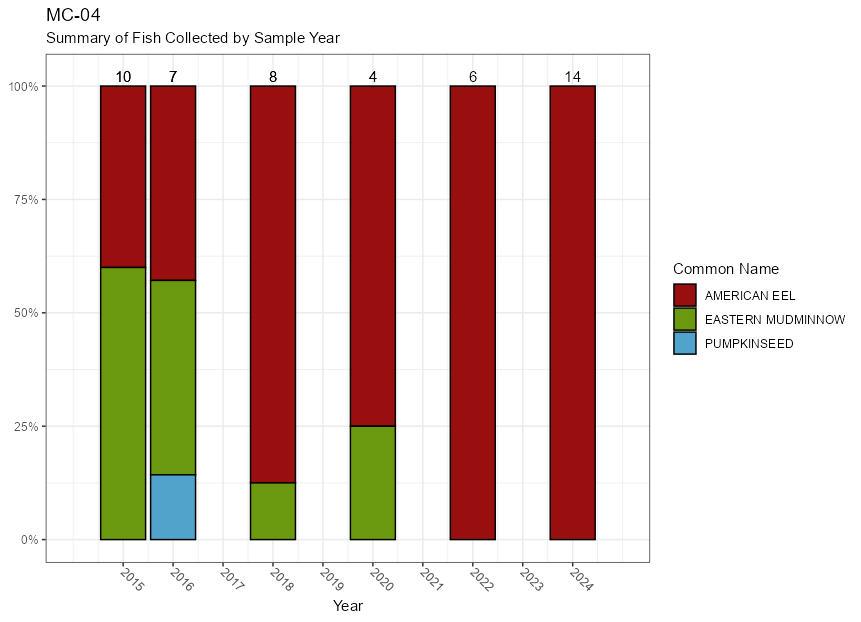
Site MC-04: The site received a FIBI score of 1.67 (Very Poor) in 2024, the same score received in the 2018, 2020, and 2022 monitoring years. American eel (Anguilla rostrata) was the only species observed here in 2022 and 2024.
MC-04 Summary of Fish Collected by Sample Year:
Site MC-01: In 2024, habitat conditions resulted in an RBP score of 137 (Supporting). The site had been rated as “Partially Supporting” or “Supporting” in all years prior to restoration, and scored 156 (Comparable to Reference Conditions) in 2022, immediately following restoration. The subsequent 3-year running average habitat score is now 146 (Supporting).
Site MC-02: The 2024 RBP score for MC-02 was 103 (Partially Supporting). The site has consistently been within the high end of scores in the “Non-Supporting” category and low end of scores in the “Partially Supporting” category since 2011. Despite having a substantial intact surrounding forest buffer, low bank stability and sparse bank vegetation continue to depress RBP scores.
Site MC-03: In 2024, the site received an RBP score of 102 (Partially Supporting). Habitat quality has been rated as "Partially Supporting” or “Supporting” eight of the past ten years. The cumulative average RBP score is 116 (Partially Supporting) and the three year running average is 108 (Partially Supporting).
Site MC-04: An RBP score of 102 (Partially Supporting) was obtained at the site in 2024. The habitat has been rated as “Partially Supporting” for nine straight years, and 13 of the 15 total years of monitoring at the site.
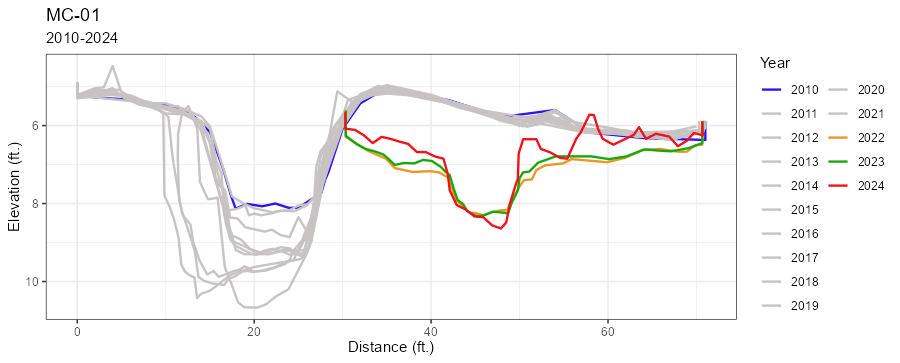
Site MC-01: An examination of the cross section measurements indicates that this stream reach experienced instability prior to restoration (years 2010-2021). Severe incision of the stream bed occurred over that time frame, as the elevation of the channel bottom dropped by nearly three feet between 2010 and 2021. The stream restoration completed in 2022 required the reconstruction of the upper 100 meters of this stream on the opposite side of the river valley. The 2024 measurements indicate significant deposition of sediment on both the left and right banks/floodplains.
MC-01 Cross-Section Comparison:
-
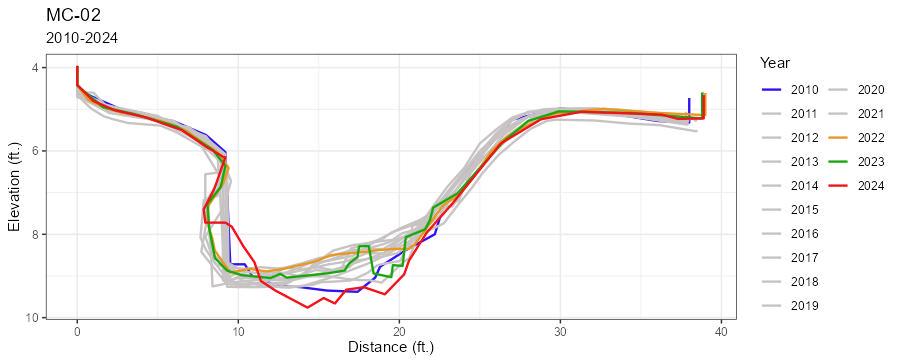
Site MC-02: Little change has occurred in the channel form at MC-02 since measurements began in 2010 aside from an undercut that began forming on the left bank in 2016. Over the past few years, the right side of the stream channel has experienced fluctuating periods of sediment deposition and scouring.
MC-02 Cross-Section Comparison:
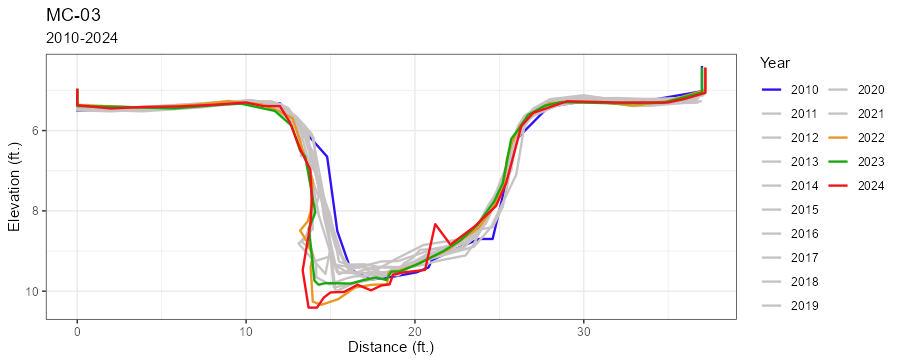
Site MC-03: The channel form at this site has remained relatively stable since 2010, although a slight retreat of the left bank and downcutting on the left margin of the stream bed has been observed over the years.
MC-03 Cross-Section Comparison:
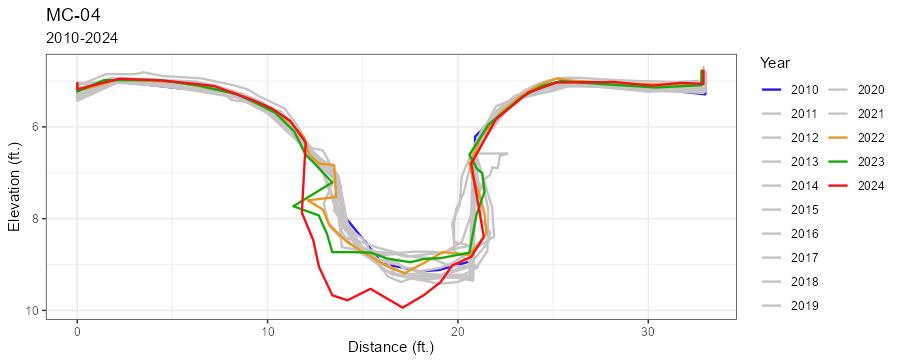
Site MC-04: Between 2010 and 2023, measurements at this site showed little change as incision and deposition oscillated with typical changes from year to year of around 0.2 feet or less. An undercut began to form on the left bank in 2021 culminating in a significant loss of bank material in 2024. In addition, the channel bottom downcut by approximately one foot between 2023 and 2024. Future assessments at this site are needed to conclude if the site is becoming unstable.
MC-04 Cross-Section Comparison:
| MC-01 | |||
|---|---|---|---|
| Year | BIBI (Condition) | FIBI (Condition) | RPB (Condition) |
| 2010 | 1.86 (VP) | --- | 123 (PS) |
| 2011 | 3.00 (F) | --- | 120 (PS) |
| 2012 | 2.43 (P) | --- | 128 (S) |
| 2013 | 2.14 (P) | --- | 125 (PS) |
| 2014 | 3.00 (F) | --- | 111 (PS) |
| 2015 | 3.00 (P) | 3.00 (F) | 117 (PS) |
| 2016 | 2.71 (P) | 2.67 (P) | 125 (PS) |
| 2017 | 2.43 (P) | --- | 114 (PS) |
| 2018 | 2.71 (P) | 2.33 (P) | 125 (PS) |
| 2019 | 2.43 (P) | -- | 110 (PS) |
| 2020 | 3.00 (F) | 3.00 (F) | 110 (PS) |
| 2021 | 2.71 (P) | -- | 125 (PS) |
| 2022 | 2.14 (P) | 3.33 (F) | 1 |
| 2023 | 2.71 (P) | -- | 145 (S) |
2024 | 2.43 (P) | 2.00 (P) | 137 (S) |
| MC-02 | |||
|---|---|---|---|
| Year | BIBI (Condition) | FIBI (Condition) | RBP (Condition) |
| 2010 | 3.00 (F) | --- | 130 (S) |
| 2011 | 2.71 (P) | --- | 107 (PS) |
| 2012 | 3.29 (F) | --- | 102 (PS) |
| 2013 | 2.71 (P) | --- | 104 (PS) |
| 2014 | 3.00 (F) | --- | 103 (PS) |
| 2015 | 1.86 (VP) | 1.67 (VP) | 93 (NS) |
| 2016 | 1.57 (VP) | 1.67 (VP) | 123 (PS) |
| 2017 | 3.00 (F) | --- | 109 (PS) |
| 2018 | 1.00 (VP) | 1.67 (VP) | 123 (PS) |
| 2019 | 2.14 (P) | -- | 121 (PS) |
| 2020 | 2.14 (P) | 1.67 (VP) | 88 (NS) |
| 2021 | 2.71 (P) | -- | 110 (PS) |
| 2022 | 2.71 (P) | 1.67 (VP) | 99 (NS) |
| 2023 | 1.86 (VP) | -- | 109 (PS) |
2024 | 2.71 (P) | 1.67 (VP) | 103 (PS) |
| MC-03 | |||
|---|---|---|---|
| Year | BIBI (Condition) | FIBI (Condition) | RPB (Condition) |
| 2010 | 2.71 (P) | --- | 111 (PS) |
| 2011 | 2.43 (P) | --- | 115 (PS) |
| 2012 | 2.14 (P) | --- | 133 (S) |
| 2013 | 3.00 (F) | --- | 113 (PS) |
| 2014 | 3.00 (F) | --- | 117 (PS) |
| 2015 | 3.00 (F) | 2.00 (P) | 98 (NS) |
| 2016 | 2.71 (P) | 2.33 (P) | 133 (S) |
| 2017 | 2.71 (P) | --- | 102 (PS) |
| 2018 | 1.00 (VP) | 1.67 (VP) | 136 (S) |
| 2019 | 2.14 (P) | -- | 118 (PS) |
| 2020 | 2.71 (P) | 1.67 (VP) | 99 (NS) |
| 2021 | 1.00 (VP) | -- | 137 (S) |
| 2022 | 2.71 (P) | 2.00 (P) | 103 (PS) |
| 2023 | 2.71 (P) | -- | 119 (PS) |
2024 | 3.00 (F) | 1.67 (VP) | 102 (PS) |
| MC-04 | |||
|---|---|---|---|
| Year | BIBI (Condition) | FIBI (Condition) | RBP (Condition) |
| 2010 | 2.43 (P) | --- | 113 (PS) |
| 2011 | 2.71 (P) | --- | 110 (PS) |
| 2012 | 2.14 (P) | --- | 122 (PS) |
| 2013 | 2.14 (P) | --- | 100 (NS) |
| 2014 | 2.71 (P) | --- | 108 (PS) |
| 2015 | 1.57 (VP) | 2.00 (P) | 89 (NS) |
| 2016 | 2.71 (P) | 2.00 (P) | 114 (PS) |
| 2017 | 2.71 (P) | --- | 111 (PS) |
| 2018 | 3.00 (F) | 1.67 (VP) | 121 (PS) |
| 2019 | 2.71 (P) | -- | 110 (PS) |
| 2020 | 2.14 (P) | 1.67 (VP) | 99 (NS) |
| 2021 | 2.14 (P) | -- | 121 (PS) |
| 2022 | 2.14 (P) | 1.67 (VP) | 104 (PS) |
| 2023 | 2.14 (P) | -- | 122 (PS) |
2024 | 2.14 (P) | 1.67 (VP) | 102 (PS) |
| Station Summary | ||||||
|---|---|---|---|---|---|---|
| Average BIBI (SD) | 3-Year Average BIBI (SD) | Average RPB (SD) | 3-Year Average RBP (SD) | Average FIBI (SD) | 3-Year FIBI Average (SD) | |
| MC-01 | 2.58 (0.36) | 2.43 (0.29) | 125 (13) | 146 (10) | 2.72 (0.49) | 2.78 (0.69) |
| MC-02 | 2.43 (0.64) | 2.43 (0.49) | 108 (11) | 104 (5) | 1.67 (0.00) | 1.67 (0.00) |
| MC-03 | 2.47 (0.66) | 2.81 (0.17) | 116 (14) | 108 (10) | 1.89 (0.27) | 1.78 (0.19) |
| MC-04 | 2.37 (0.38) | 2.14 (0.00) | 111 (10) | 109 (11) | 1.78 (0.17) | 1.67 (0.00) |
SD = Standard Deviation